System Maintenance occurs every Friday.
System Maintenance occurs every Friday.
Residual Gas Analysis (RGA) for Integrated Circuits (ICs) is the identification of gaseous components that can be extracted from a microelectronic package cavity.
MIL-STD-883D, Method 1018.2, Internal Water Vapor Content exists for the purpose of identifying a standard procedure to be used, but a detailed understanding of the technique with effects which may be encountered will help the analyst reach a correct conclusion. These effects may include those not specifically treated in a standard or reactions which occur below stated failure thresholds.
Three analysis methods are described in MIL-STD-883D, Method 1018.2. Mass spectrometry is the most common method for general RGA and moisture analysis. Integrating moisture in a dry carrier gas is a second technique for moisture analysis. A third technique for moisture analysis is the inclusion of a calibrated sensor within the IC package cavity. This treatment will deal with the mass spectrometer approach.
Gas analysis of hermetic containers has been performed for more than 25 years using mass spectrometry. Gas analysis initially began on vacuum tubes and relay cans. Because most vacuum tubes and relay cans involve relatively lare volumes (> 10 cm3), standard leak valve sampling techniques could be used. Although these techniques were not accurate in the absolute sense, then did provide useful relative concentrations. In fact, gas analysis techniques were key in extending the operating life of relay contacts and vacuum tubes. Although it was possible to obtain better than 10% accuracy on most gases within a small volume, water vapor was an exception. As recently as the late 1970's, results from water vapor tests could be more than an order of magnitude different.
In the late 1970's Rome Air Development Center began a comprehensive study among four commercial laboratories. By 1980, they were able to achieve correlation at 5000 ppm moisture (±20%) for packages with volumes between 0.01 and 0.85 cm3. The nomograph in Figure 1 indicates how moisture content compares with dew point and internal pressure.


Since microelectronic packages are usually backfilled with dry nitrogen gas or air near atmospheric pressure before being hermetically sealed, a technique capable of identifying and measuring very small amounts of gas in the presence of a large quantity of nitrogen is required. A technique eminently suitable for this task is mass spectrometry.
A word of caution to the neophyte in moisture analysis or the residual gas analysis technician: past experience has shown that changing over an RGA or GC-MS system to obtain correlatable moisture readings usually requires a large number of man hours. Typical conversion time ranges from at least six months to sometimes more than a year. Even purchasing a turn-key system such as that available from Pernicka Corp. will require months of training to understand how the many system variables affect the analysis results. Therefore, before embarking on setting up a moisture analysis system for microelectronic devices, a very careful and realistic cost trade-off should be performed. This is especially true since most IC packaging is now plastic, and hermetically sealed packages constitute a smaller and smaller percentage, even in the military and high reliability markets.
A mass spectrometer is an instrument that produces gaseous ions from a sample, separates these ions, detects them, and records their relative abundances as a function of their mass-to-charge (m/z) ratios. This record is called a mass spectrum. There are three commonly available types of mass spectrometers: quadrupole and monopole, magnetic sector, and time-of-flight. Of these three types of instruments generally available, the relatively small size and fast scan rates that can be achieved with the quadrupole have made it the most popular choice for gas analyzers.
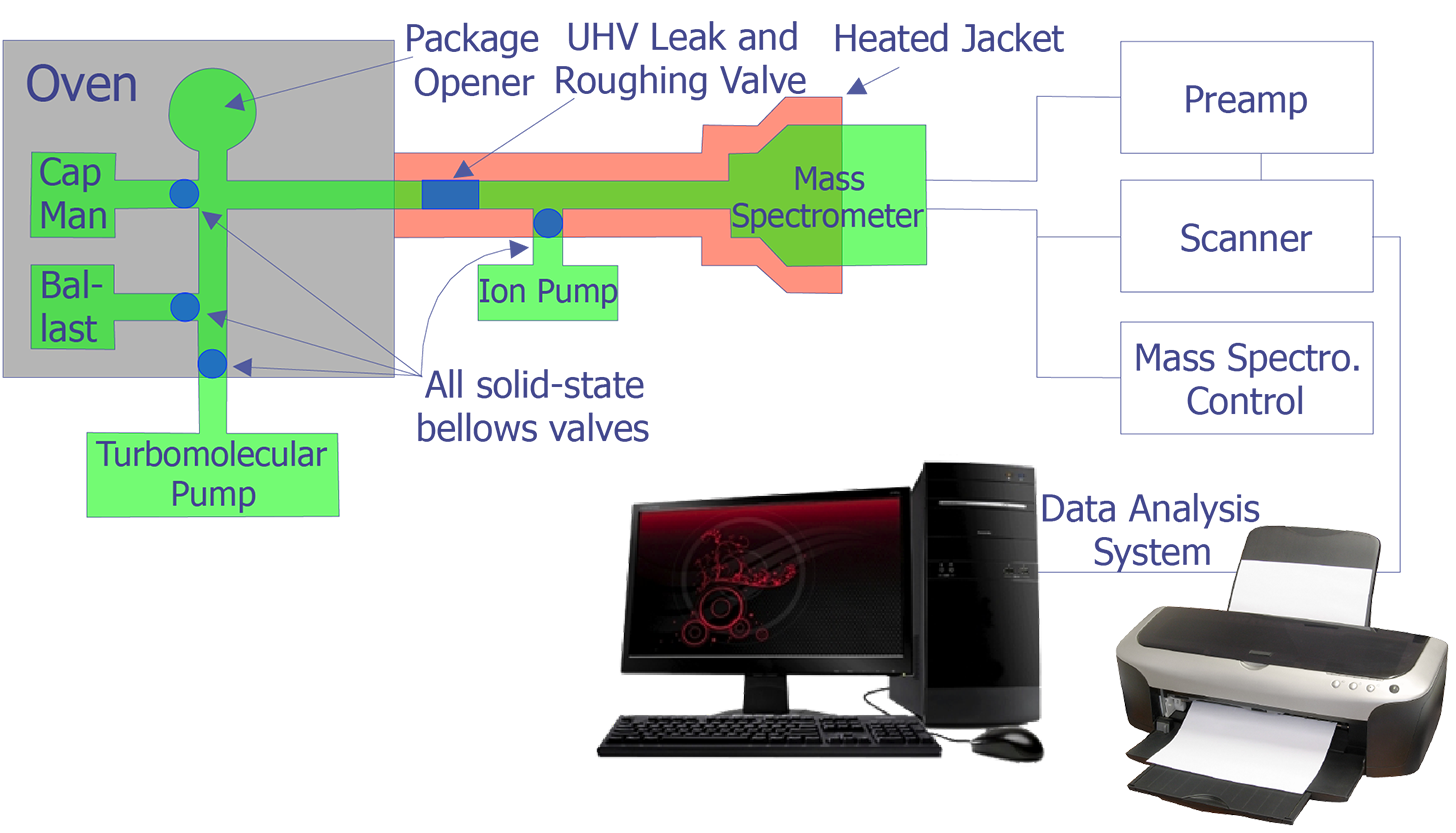
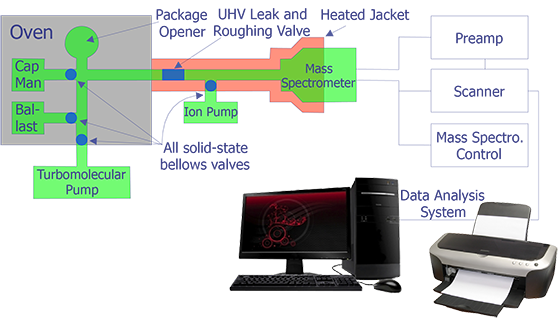
The incorporation of a mass spectrometer in a package ambient gas analysis system has been described by Thomas. Figure 2 indicates the essential features of such a system. Several samples are loaded simultaneously in "batches" on a rotary holder. The system is them vacuum-baked for a period of time; this is necessary to insure low gaseous background levels.
Another system for package ambient gas analysis is the rapid cycle system. This system features a fifteen (15) minute cycle time from sample loading to gas analysis and then sample removal.
Each system has advantages in application to the users' gas analysis requirements. However, comparison of data from these two systems must consider the different thermal stresses each presents to the microelectronic package and its internal materials.
The package opening system must do the following:
The mass spectrometer should be capable of:
The actual analysis requires three sets of data: background, calibration, and sample. The background spectrum allows correction for the signal in the system arising from hot filament reactions, desorption of gases from system walls, and those small but constant leaks to which every vacuum system is prone. Since small IC packages may have less than 1 microgram of moisture, it is absolutely necessary that the moisture background due to leakage be eliminated from the background. Otherwise, it will completely swamp (mask the actual) sample moisture content. System dryness can be measured by running an absolutely dry calibration burst. If the background moisture peak (mass 18) does not depress or increase during opening of the dry sample, the system is sufficiently leak-free for performing moisture analysis. The peaks commonly seen include m/z values 2, 18, 28, and 44.
The key to success in any gas analysis system used to measure moisture lies in the ability to reproducibly generate constant volumes of gas containing known moisture content. Outwardly, this may seem very simple. However, it has been proven to be a very difficult task. Some years ago, a calibration system was developed which accurately simulates small package volumes (0.01, 0.1, 0.85 cm3) while at the same time making it possible to control the moisture content. This system, coupled with a two-pressure moisture generator, has now been in use at four commercial gas analysis laboratories and Rome Labs since 1979 and has made it possible to achieve analysis correlation to better than ±20% at 5000 ppm for volumes between 0.01 cm3 and 0.85 cm3. Each of the calibration systems has been checked with a NIST calibrated dew point hygrometer and demonstrated an accuracy of better than ±0.5oC dew point.
The simplest approach to package gas analysis is to record a mass spectrum after the package has been opened using a static sample method at a constant pressure. The difficulty with this approach is seen in Figure 3 where the relative intensity is recorded as a function of time after package opening. It is seen that the rates of escape of the various components of the ambient gas from the package and their detection is not uniform. On the contrary, except for the very anomalous behavior of the water vapor, there appears to be a dependence on the molecular mass of the various species. This observation indicates the need for an integrated measurement of each gas component over a reasonable time period to give reproducible results. Of course, the practical way of achieving time-integrated spectrum intensity measurements is through a computer system. With the appropriate interface unit and through the use of such programming techniques as multiple ion detection, background subtraction, and quantitative calibration software, the accuracy and precision of measurement can be increased by a factor of 100.


Example
The application of the mass spectrometric technique to the analysis of the backfill gas in a large volume package is presented below. A quadrupole mass spectrometer was used to perform the analysis, and the data were captured by a computer. The figures are reproductions of the experimental data. The four sets of data were obtained as depicted in Figures 4 through 7. Figure 4 represents the background spectrum of the instrument before room air (used as a calibration standard) was admitted to the ion source.


The assumption that is made throughout these calculations is that the intensity (height) or any mass peak represents a summation of the contributions of all ions of a given m/z value, regardless of their origin. Also, the background contributions are assumed to be constant during the course of the experimental measurements.
The largest peak in the background arises from water, H2O (m/z = 18), with its accompanying fragment peaks at (m/z = 16 and 17). Peak 28 arises from both carbon monoxide (CO) and nitrogen (N2) gases and, or course m/z = 32 corresponds to oxygen gas (O2).
In Figure 5, the mass spectrum of room air, one can easily recognize that the very small peaks at 40 and 44 (multiplied fifty fold (50X) for display purposes) represent argon (Ar) and carbon dioxide (CO2), respectively. The peak at 14 is a composite derived from nitrogren N2+ and N+, while peak 29 is an isotope peak of N2 (N14.N15).
Figure 6 is a background spectrum taken just before the device package was punctured.
Figure 7 shows the mass spectrum of the relay package fill gas. Note the very low levels of O2 compared to N2. A multiplier of 500 was used in order to show their relative abundances in the spectrum. The instrument was scanned from mass 1 through mass 100; however, low molecular mass organic compounds appear to be absent. The mass-intensity data pairs for the air sample and background are presented in Figure 8
| Component | Molecular Peak (m/z) | Air | Background | Air (Collected) | Sensitivity (1013) |
|---|---|---|---|---|---|
| N2 | 28 | 1476600 | 16256 | 1460334 | 2.20 |
| O2 | 32 | 398336 | 7968 | 390368 | 2.19 |
| Ar | 40 | 23264 | 50 | 23214 | 2.93 |
| CO2 | 44 | 5904 | 0 | 5904 | 21.10 |
Calculations
The sensitivity, S, of an instrument to a particular species is expressed as the peak intensity (or height) per unit measure.


where I = peak intensity and P = pressure. For the various species that comprise air, the pressure is the partial pressure of the species, that is:


where PC = partial pressure of component C, FC = fraction of component C in air, and PT = total pressure of sample.
The values of FC for air are given in Figure 9.
| Component | FC |
|---|---|
| N2 | 0.7809 |
| O2 | 0.2095 |
| Ar | 0.00934 |
| CO2 | 0.00033 |
For example, the sensitivity of the instrument to N2 is:


Using the data in Table II,


intensity units per torr.
Note that the corrected intensity of N2 is used in the calculation since the instrument background contributes to the intensity at m/z = 28.
The same approach is used for the other components of air, and the calculated sensitivities are recorded in Figure 8.
The mass-intensity pairs for the device and instrument background are given in Figure 10. Rewriting the sensitivity equation, one obtains a relationship for calculating the fraction of component C in the sample
| Component | Molecular Peak (m/z) | Device | Background | Device (Corrected) | FC(103) | % (V/V) |
|---|---|---|---|---|---|---|
| N2 | 28 | 2568190 | 4416 | 2563774 | 1.371 | 99+ |
| O2 | 32 | 1644 | 729 | 915 | 0.491 | 0.036 |
| Ar | 40 | 475 | -- | 475 | 0.191 | 0.014 |
| CO2 | 44 | 2916 | -- | 2916 | 0.163 | 0.012 |


Thus, for N2 in the relay


where PT is the total pressure of the relay gas in the mass spectrometer


The rather absurd result points up a critical problem in these types of measurements: the actual pressure of the sample. Note that in a proper set-up, provision has been made for a gas pressure measurement via the capacitance nanometer. However, the sensitivity of the instrument should be relatively unaffected by sample pressure differences over a wide range. The more important thing is that the pressure of the sample remain essentially constant during the measurement. If this is true, then the relative fractions of components in the sample should remain virtually constant.
The precision in measurements of this type in a quadrupole mass spectrometer is subject to many factors. Experience indicates that a precision of ±1% appears to be a lower limit. Therefore, the calculated values for percent of each component must be adjusted to account for this precision level. These calculations were made ignoring the moisture content because there was very little difference between the background reading and the sample reading and points to the necessity of very accurate control over background measurements.
The gas ambient of a microelectron package is not a static system. One of the most dramatic changes which occurs in the package ambient takes place immediately after seal. If the seal is made in dry nitrogen (5 ppm moisture) and parts are used which have not been baked out, the ambient in the package changes from 5 ppm to 5000 ppm moisture within a matter of seconds. This desorption of moisture from the ceramic or metal parts continues for several days, reaching moisture contents greater than 15,000 ppm even though the package was sealed in a dry atmosphere. The outgassing of moisture from the interior walls of the package also affects the interpretation of the reported moisture content. It is fair to say that the reported moisture at 100°C is always greater than the amount actually in the ambient. This fact becomes important if one wants to relate the measured moisture back to the dew point.
To calculate the dew point, several assumptions are required:
All the moisture in an enclosed volume must remain in the vapor state (since dew point concerns only the molecules of moisture in a volume of gas)
No moisture is removed from the ambient by the walls of the package.
Refer back to Figure 1 for a nomograph which converts parts per million (ppm) moisture to dew point at constant pressure.
The purpose of the dew point test, a non-destructive test method, is to detect the presence of moisture trapped inside an integrated circuit or hybrid microelectronics package. The device is mounted in a suitable socket and the necessary leads to monitor some electrical parameter which would be sensitive to surface conductivity due to condensed moisture. Typical electrical parameters used are ICBO leakage current on transistors, input offset voltage, or supply current on operational amplifiers, and IDDQ on CMOS integrated circuits. The transient change in the observed electrical parameter as the device goes through the wet phase of the dew point is an effective indicator of entrapped moisture. This technique is a qualitative method only. The amount of change noted is dependent upon excitation, entrapped water, and amounts of residual chemicals which are left on the die and may become conductive.
The general procedure is as follows:
Most RGA of ICs is fueled by an interest in internal moisture content because of its potential to enhance corrosion and conduction and, therefore, to interfere with the functionality or performance of an IC. The analysis of other gases which are extracted from the package can also yield information about the history of a microelectronic device. Using RGA, it is possible to gain information about processing or storage conditions, hermeticity, material reactions, or contamination.
The following are various gaseous components that can be detected using RGA and conclusions that can be drawn from their presence.
Water provides mobility for ions in electrochemical reactions and electric charge transport. It is probably the most damaging contaminant because it plays a part in a number of different failure mechanisms. In some cases, its presence is necessary and sufficient to cause failures; in others, it is necessary, but not sufficient; that is, other contaminants or structural conditions must occur. Moisture typically is brought into the package cavity adsorbed on the walls of the package interior or is due to a loss of hermeticity (where the ambient environment gases enter the package cavity). The dryness of the sealing environment has little effect on the final moisture content of the package. Adsorbed moisture can be more than sufficient to bring the package cavity to high dew point levels. Some failure mechanisms related to moisture content in the package cavity include: corrosion, electrical surface leakage, electrochemical metal migration, electrical degradation of the bulk oxide (causes subthreshold leakage or VT shifts), or polar inversion layers.
Oxygen gas in packages can cause aluminum oxidation during high temperature burn-in or operation. This condition can lead to a beneficial passivation layer. It has been shown to be necessary in the case of solder glass sealed parted such as ceramic dual in-line packages to have from 10 to 20% oxygen in the sealing furnace. Since oxygen is consumed at high temperatures, the residual oxygen in the package is very often less than one-half the amount present in the sealing furnace. In a negative way, there is some indication that excessive oxygen can result in a beta shift in some bipolar devices because of its polar effect on surface charge inversion.
Since argon is inert, it makes an excellent tracer gas for independent leak assessment. If the parts are sealed in nitrogen or nitrogen-oxygen mixtures, the detection of argon would indicate that the package became non-hermetic sometime after seal. Since leakage paths can easily plug or dissimilar material seals may open temporarily during thermal excursions, seal leakage may occur even though the package will pass fine and gross leakage tests. Noting other gaseous components accompanying argon can often identify at what point in the package history that hermeticity was lost.
Carbon dioxide readily forms electron attachment (negative) ions which can affect surface charge status. When dissolved in water, it forms a weak acid that can promote galvanic corrosion. Finally, when CO2 is found in a package, it can be interpreted as one of the end products in a sealing furnace ambient or the oxidation of a hydrocarbon residue associated with package materials or contamination, some of which may still be present on the IC die or in the package.
The presence of He or Freon usually indicates a fine or gross leak condition is present or has occurred at some time prior to gas analysis, e.g., screen escapes. Correlate with argon, total pressure, oxygen, or other contaminants to determine mechanism.
Methane is often produced during analysis as the fractionated portion of some heavier hydrocarbon (i.e., grease or oil).
Pump oil results from contaminated vacuum bakeout ovens (mass 55, 56, and 57).
Chlorine is present as a fractionated ion formed from a chlorinated hydrocarbon. Free chlorine is too reactive to exist as a free molecule.
Halogen compound residues are always cause for alarm because they can so readily initiate aluminum corrosion in the presence of traces of moisture. In this case, halogens do not usually become chemcially bound in the reaction products. Instead they play an intermediate role in breaching the normally protective aluminum oxide. The exposed aluminum metal then reacts with water to form hydrated aluminum oxide. Since many process chemicals and solvents contain halogens (e.g., freons, trichloroethance), it is important to prevent these solvent residues from contacting water on the IC surface. The resulting hydrolysis reaction (which is catalyzed by many metals) produces halogen acids directly from the supposedly inert solvents.
Hydrogen gas is seldom found in significant amounts except when deliberately introduced as part of a "forming" gas mixture used to stabilize MOS type devices. It may outgas in small quantities from Kovar or ferrous metals or be entrapped in electroplated coatings. Hydrogen ions (protons) are highly mobile charge carriers in silicon oxides, with a mobility comparable to sodium ions.
Many organic vapors have been found in semiconductor packages from sources such as solvent residues, photoresist processes, epoxy bonding, etc. Most of them are relatively harmless and have not been directly correlated with failures. They sometimes are indicative of sloppy processing and should be noted for that reason. Some organic residues that are detected by their vapors may contain impurity metal ions in the solid state which can be surface charge carriers.
In at least one case, acetic acid was detected during mass spectrometer analysis. It was traced to the use of single component silicone "bathtub" resin, which, of course, should never be used in microelectronic applications. In this instance, the acetic acid destroyed the Dumet seals on glass signal diodes. Amines are sometimes detected from epoxy curing systems and may contribute to aluminum corrosion, since aluminum is amphoteric.
RGA is readily available to the failure analyst through the services of an analysis laboratory. Some facilities will have the capability on their own premises. There are many variables in extracting gases (particularly moisture). At times, information can be gained by running the analysis per a fixed procedure at a particular apparatus--even though the results from a different apparatus may be offset by some amount.
Typically, a package is introduced into a vacuum chamber and baked in order to remove adsorbed gases from the exterior of the package. If prebaked for 12 to 24 hours at 100°C +5°C, a faster cycle can be accomplished by hot insertion into the vacuum chamber. Method 1018.2 then calls for a minimum of ten minutes at 100°C +5°C in the vacuum chamber. When this is achieved, the package is punctured in-situ, and the gaseous contents of the package cavity are released into the vacuum chamber. Ceramic lids can be punctured successfully if they are thinned prior to insertion in the apparatus. The released gases are then sampled from the vacuum chamber by a mass spectrometer. It is important that the apparatus be calibrated in the concentration range where the sample is analyzed. Method 1018.2 calls for calibration for moisture at the moisture limit (5000 ppm). The pressure increase in the vacuum chamber is an important measurement as it relates to the total gas content. Naturally, this is different for packages of different cavity size. All gases present greater than 1 percent by volume are reported. In fact, analysis of data can guide decisions well below this level (see results section).
RGA analysis should be performed after all seal integrity testing as the hermeticity of the package will be destroyed in the sampling procedure. Following RGA, the lid can be removed for subsequent failure analysis. Because there is some chance that the package opening needle will damage the IC die, RGA should only be tried if there are multiple samples, or if all other causes of failure have been ruled out with a high degree of confidence.