Are you looking for more information regarding this and other subjects? Look no further than Semitracks' Online Training. Semitracks' Online Training contains short courses and other material useful for any Engineer trying to learn new subjects or brush up on old ones.
What is Liquid Crystal Analysis?
Liquid crystal analysis is useful in detecting and characterizing thermal flow on semiconductor surfaces or mapping electrical current through IC interconnects. Liquid crystals are classified in two groups: cholesteric and nematic. Cholesteric crystals respond to thermal conditions, while nematic crystals respond to electrical currents. Their behavior differs by the nature of conditions required to induce changes in their apparent crystal orientation.
Cholesteric crystals respond to the semiconductor surface temperature by altering the refractive and reflective properties with the temperature change. This effect is called circular dichronism.
Nematic crystals respond by aligning themselves parallel to a changing magnetic field. Thus, an electrical current will induce an alignment of the crystals and change their optical properties. These crystals are useful in determining both temperature and voltage states of the die surface. The spatial resolution is limited to approximately 10-20 um, quite gross for today's ICs, and the temperature resolution is limited to about 0.5°C. The materials and equipment necessary to perform this test are relatively inexpensive. This analysis is nondestructive, and only the package lid needs to be removed.
Why Perform Liquid Crystal Analysis?
Liquid crystal analysis can be useful in characterizing thermal flow and displaying voltage states of ICs that have anomalous current or circuit malfunction. These failure sites are most often due to submicron gate oxide defects. The technique has also been shown to aid in circuit layout mapping.
How is Liquid Crystal Analysis Performed?
Warning: Extreme care should be used when liquid crystal materials are handled. The toxicity of some of these materials is unknown.
In general, the laboratory equipment set consists of:
- microscope with polarizing filter set
- oven, heating socket, temperature stage, or infrared heating lamp
- liquid crystal solution
- temperature indicator.
The following describes procedures to perform liquid crystal analysis.
Procedure for Cholesteric Crystals:
- Determine temperature range of crystals used. These often vary between 30 to 80°C. (If a crystal is chosen which has a working temperature just above room temperature, a stage with heating and cooling capabilities is eliminated.)
- Apply the crystals to the die using a medicine dropper for liquids and an artist's brush for waxy materials. After application, it is best to spread the material uniformly over the surface with a spinner. A wetting agent may also be used to help spread the material. The device is then dried at 50°C in an oven or with a lamp. The crystals are deposited in the isotropic phase, where the molecules are randomly oriented and have optical properties in all directions. Under light field illumination, the deposited film appears clear. Under polarized light and using a polarizer, the film appears black. To correctly observe the phase change of the crystals, two circular polarizers are needed. One is placed immediately after the light source, while the other is placed before the eyepieces and is aligned orthogonal to the first polarizer. Note: some crystals vary in color rather than darkness. The color range for these crystals ranges from red to violet.
- The device is then mounted on a heat plate, which accurately and precisely moderates the temperature. A Peltier thermocouple is a good choice for the heating since there is very little vibration during temperature control. A fixture, such as an aluminum block, may be useful in heat transfer from the heater to the component.
- Monitor the temperature of the heater during the test and while bias is applied to the component. A digital thermometer is useful to monitor this temperature.
- Allow the temperature to rise to within a fraction of a degree of the activation temperature of the crystal. The activation temperature is the temperature at which the crystals respond.
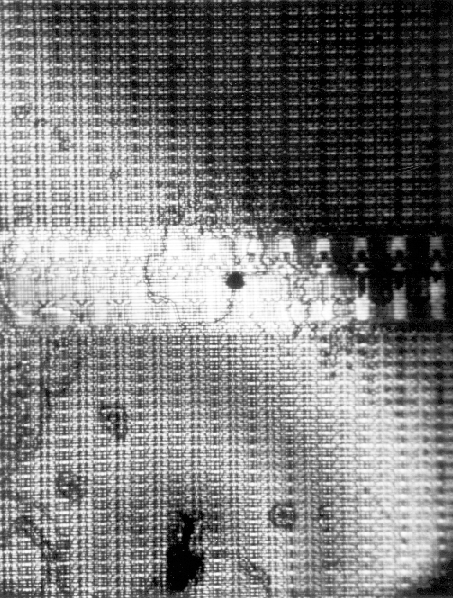
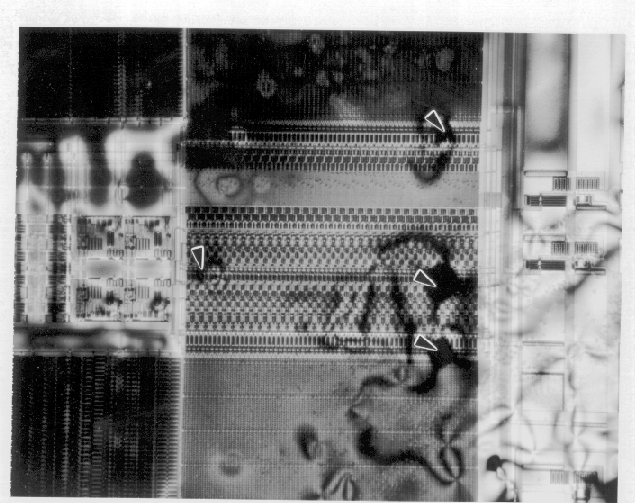
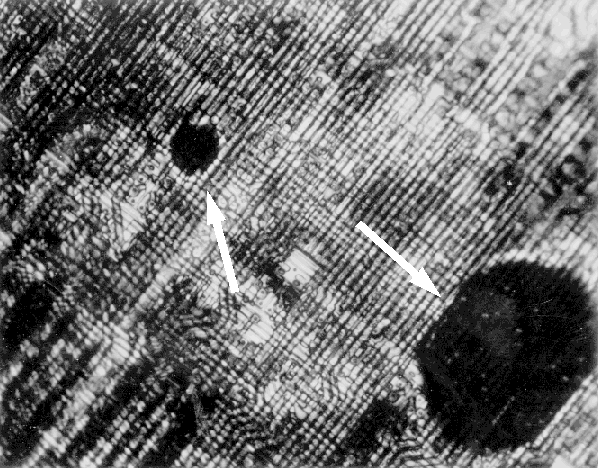
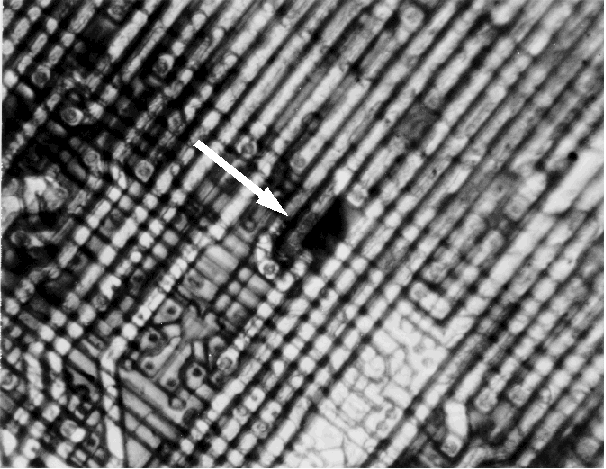
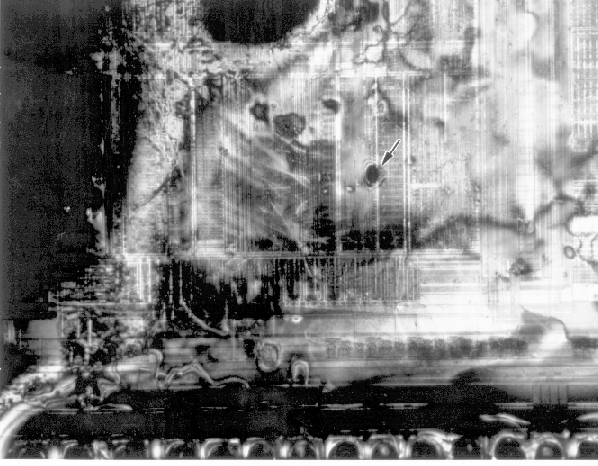
- Upon reaching the activation temperature, the heater is allowed to cool while the circuit is still under bias. If there are any localized hot spots or thermal gradients, the crystals will form circular patterns around these areas. Figures 1 and 2 show a 64k EEPROM with metal to metal shorts on the same layer. Liquid crystal can readily identify this type of defect.
- Since the effect is quite transitory, repeat the experiment until you obtain the desired results. The key to hot spot detection is the difference in the optical properties above and below the activation temperature.
- After satisfactory results are obtained, the liquid crystal can be removed with common solvents such as acetone or isopropyl alcohol.
Procedure of the Use of Nematic Crystals:
Two basic procedures are utilized - cell formation and direct low voltage crystal observation. This technique requires that the passivation and partial package be removed so that the exposed circuit is the highest surface. The exposed surface is used as the base on which an electric cell is formed. This cell consists of a clear conductive lens covering the liquid crystal and cell precludes the use of electrical probes to contact the die surface. Needless to say, the technique requires special sample preparation and fixturing.
The other technique, low voltage crystal observation, does not require the use of a cell. This is a simple procedure in which the analyst:
- Places a drop of low voltage crystal, such as 1.4 volt, on the surface of the component. The crystal orients itself with voltage and current transitions detected from the die surface.
- The component is operated and voltage/current transitions are directly observed under a microscope using polarized direct lighting as described in the above procedure.
- By using a slow frequency vector set (5 Hz), this method can detect localized shorts or opens.
- To obtain maximum utility from this technique, a digital image processing system should acquire, enhance, and process images.
Notes:
Various Liquid crystals are commercially available. For example, 4-cyano-4'hexyl-biphenyl, commercially known as K-18 by BDH (a commercial supplier), is available from various sources. K-18 is a popular LC since its state transition temperature (STT) is 29.9°C, which is very close to room temperature. LC K-21 (BDH) has an STT of 42.83°C Other LCs are available with STTs ranging from -30°C to 60°C. Merck T74 and T75 display color bands as a function of temperature. LC for special applications are commercially available with STTs of 83.5°C, 60°C, and 107°C.
Good results are obtained at a power dissipation of 1uW or more. A resolution of 1 micron square and temperature sensitivity of 0.1°C can be obtained. For smaller or deeply buried structures, the sensitivity is much lower.
Voltage-sensitive liquid crystals are only useful if the operating frequency is less than 1 MHz A 1979. Dan Burns' paper indicates that the upper useful frequency may be in the 100s of Hz. Voltage sensitive liquid crystals are also not very prevalent.
Prepare liquid crystals 1 part LC to 10 parts methanol.This will cause the liquid crystal to spread more evenly over the die. Pure liquid crystal can very viscous and not spread evenly over the die. Apply the liquid crystal to the die with a syringe. Several drops should be adequate. You can spread the LC around with a small brush or filter paper if necessary. An alternate method for achieving a uniform coating is spinning the sample on a turntable. For liquid crystals supplied in powder form, put a small amount of powder on the sample. Heat the sample until the liquid crystal melts and flows over the sample.
When is Liquid Crystal Analysis Performed?
Liquid crystal analysis is performed when one wants to locate a hot spot on the IC or determine which interconnects are electrically active for a given stimulus. Many factors, such as shorted junctions, metal lines with shorts to underlying structures, and oxide breakdown, can cause hot spots.
Since the cost of this technique is inexpensive, the analyst should perform these analyses when light emission microscopy and probing, either by mechanical or electron beam methods, cannot be performed.
References on Liquid Crystal Analysis
- J.R. Devaney, G.L. Hill, and R.G. Seippel, Failure Analysis Mechanisms, Techniques, and Photo Atlas, Failure Recognition & Training Services, Inc., Monrovia, CA.
- Failure Analysis Techniques, A Procedural Guide - Rome Air Development Center.
- O.D. Trapp, "Liquid Crystal Hot Spot Detection Kit 4300 Procedure," Technology Associates, March 31, 1988.
- J. Hiatt, "A Method of Detecting Hot Spots on Semiconductors Using Liquid Crystals," Proc. IRPS, 1981, pp. 130-133.
- A. Geol and A. Gray, "Liquid Crystal Technique as a Failure Analysis Tool," Proc. IRPS, 1980, p. 115.
- M.D. Crow, E.W. George, and R.K. Lowry, "A New Liquid Crystal for Field-Effect Viewing of 5 V Vcc Logic Families," Reliability Physics, 1982.
- G. West, "A Simple Technique for Analysis of ESD Failures of Dynamic RAMs Using Liquid Crystals," Reliability Physics, 1982.
- G. Gear, "MOS/LSI Failure Analysis Techniques," 11th Annual Proceedings, Reliability Physics Symposium, 1973, pp. 127-132.
- V. C. Kapfer et al., "Reliability Tests and Analysis of CMOS NOR gates with Application of Nematic Liquid Crystal Failure Analysis Techniques," ADC-TR-76-96, June 1976.
- C. J. Salvo, "An Improved Approach to Locating Pinhole Defects in MOS and Bipolar Integrated Circuits Using Liquid Crystals," 14th Annual Proceedings, International Reliability Physics Symposium, 1976, pp. 263-274.
- D. J. Burns, "Microcircuit Analysis Techniques Using Field Effect Liquid Crystals," 16th Annual Proceedings, International Reliability Physics Symposium, 1978, pp. 101-107.
- D. J. Channin, "Liquid Crystal Technique for Observing Integrated Circuit Operation," IEEE Transactions on Electron Devices, Oct. 1974, pp. 650-652.
- D. J. Burns, G. E. Jakobcic, M. L. Wangler, "Liquid Crystal Display Techniques for Analyzing Microprocessors," Advanced Techniques in Failure Analysis Symposium, 1979.
- M. Schadt, W. Helfrich, "Voltage-Dependent Optical Activity of a Twisted Nematic Liquid Crystal," Applied Physics Letters, Vol. 21, No. 4, February 1971, pp. 127-128.